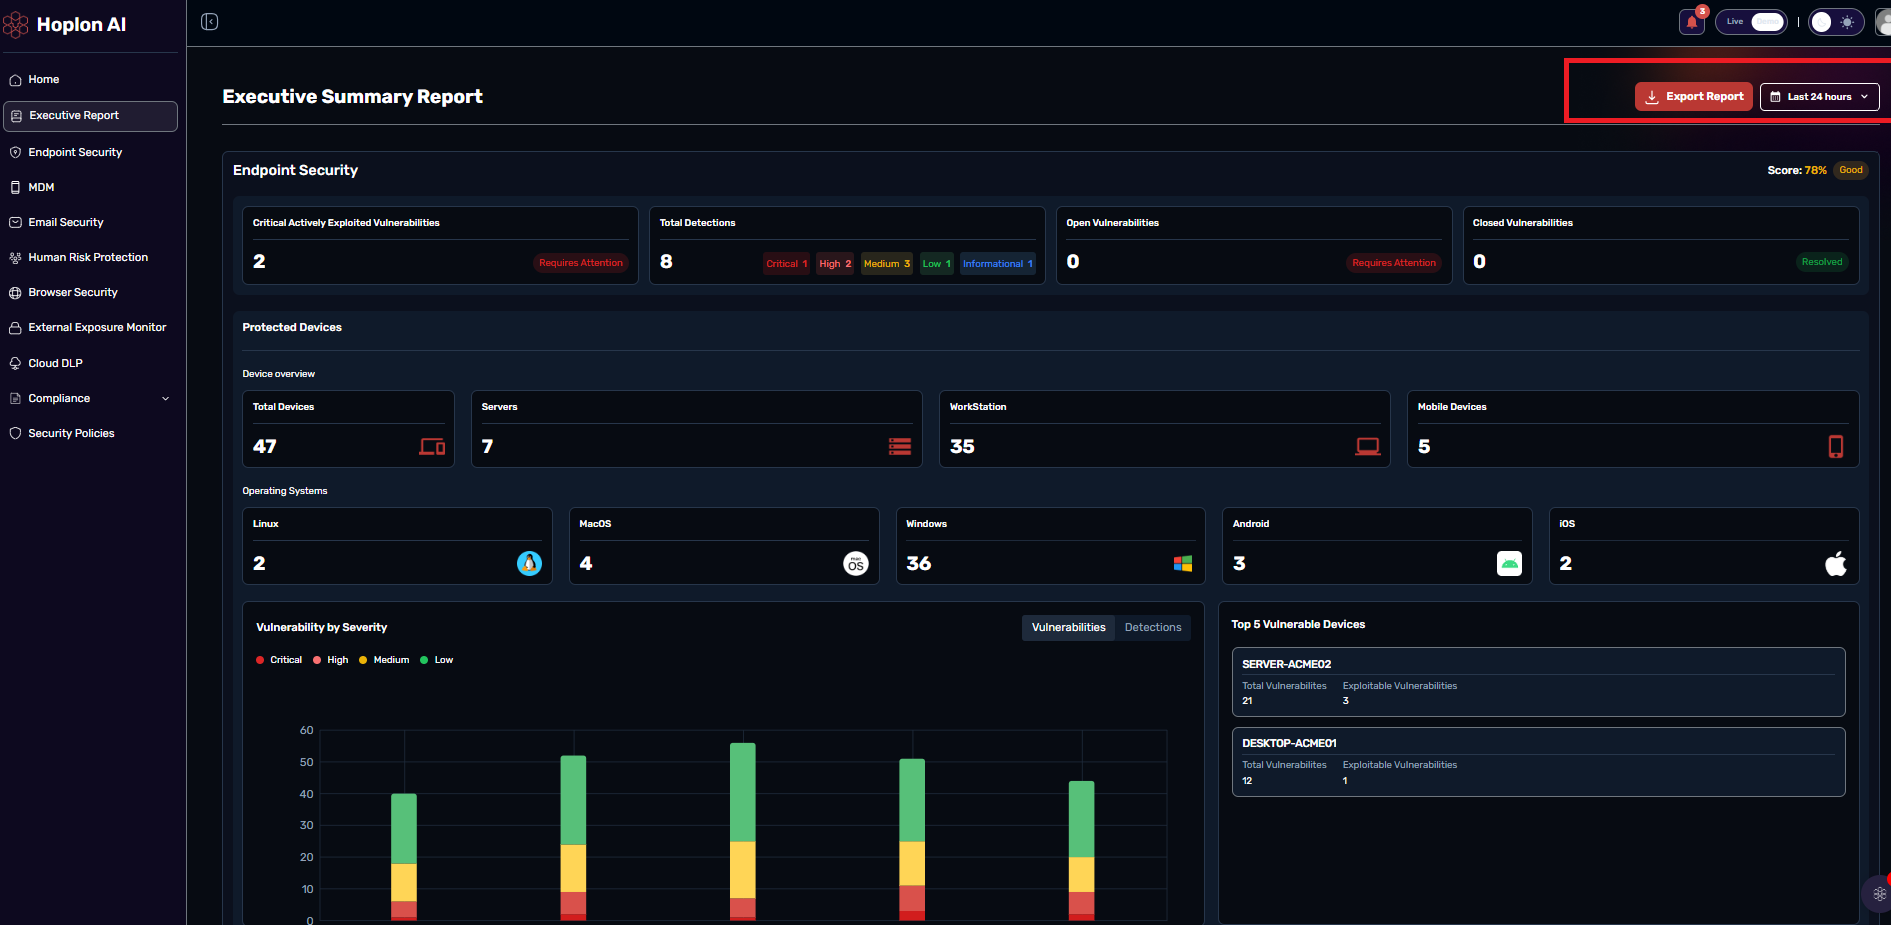
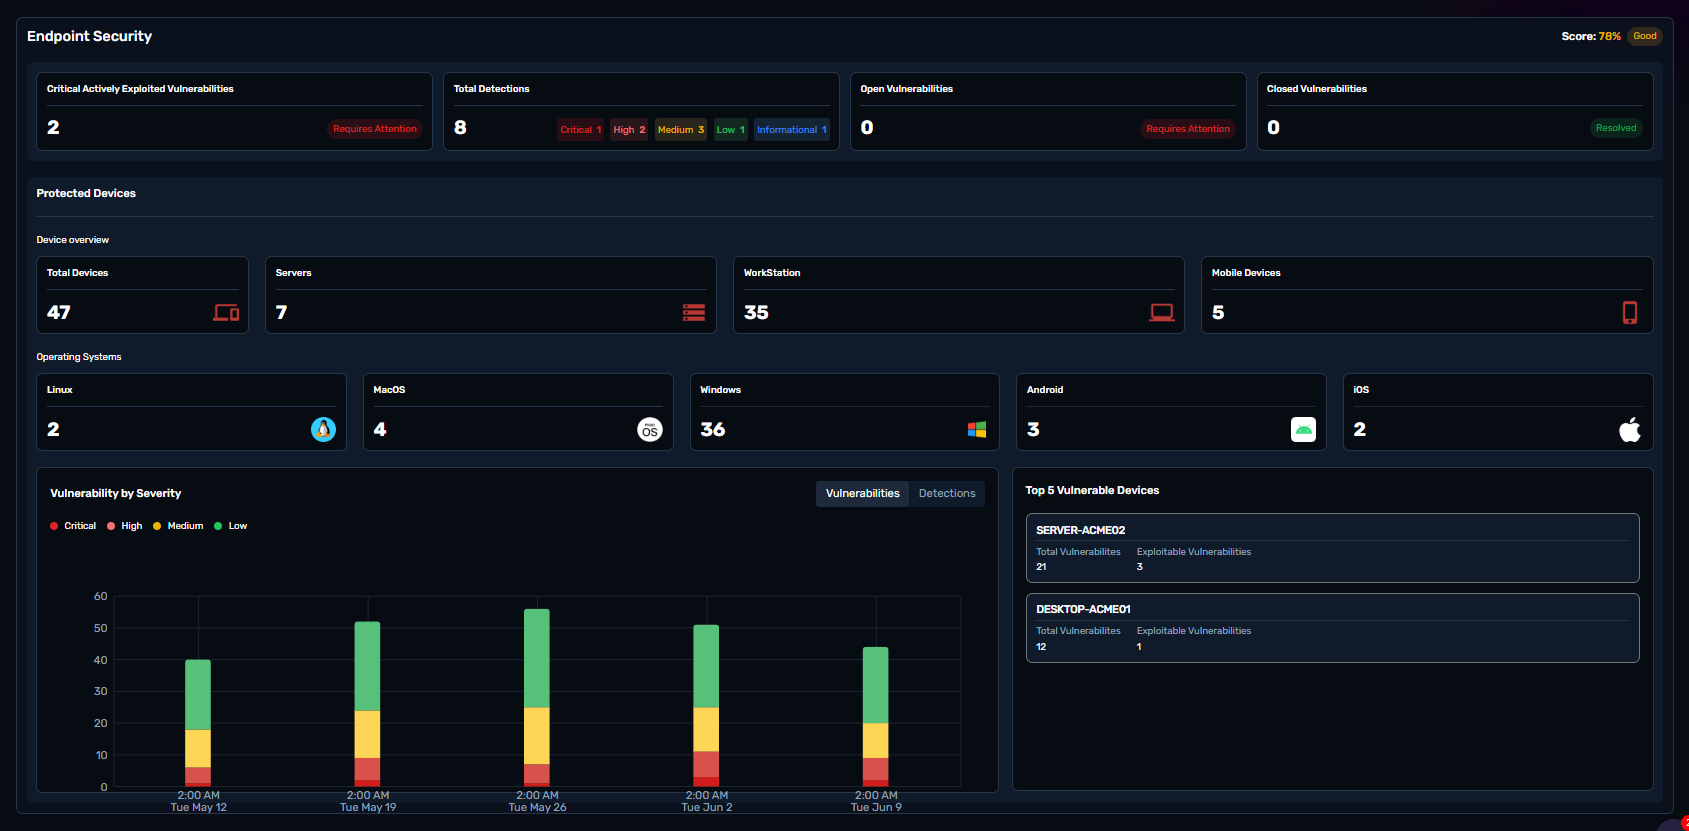
This table fetches data from the Endpoint Security module in Hoplon, providing you with the main details of that module in a condensed, executive-level view. It surfaces the number of critical, actively exploited vulnerabilities requiring immediate attention, total detections by severity, and the count of open vs. closed vulnerabilities. Below it, the Protected Devices panel breaks your fleet down by device type (servers, workstations, mobile) and operating system. The Vulnerability by Severity chart tracks how your exposure has trended week over week, and the Top 5 Vulnerable Devices list surfaces the specific endpoints with the most exploitable vulnerabilities, so remediation efforts can be prioritized.
This module fetches data from the MDM module in Hoplon, providing you with the main details of that module. It gives a fleet-level view of device enrollment and compliance status: how many devices are reporting to Hoplon, how many are enrolled in Swif MDM, how many are compliant with policy, and how many remain unmanaged or unenrolled.

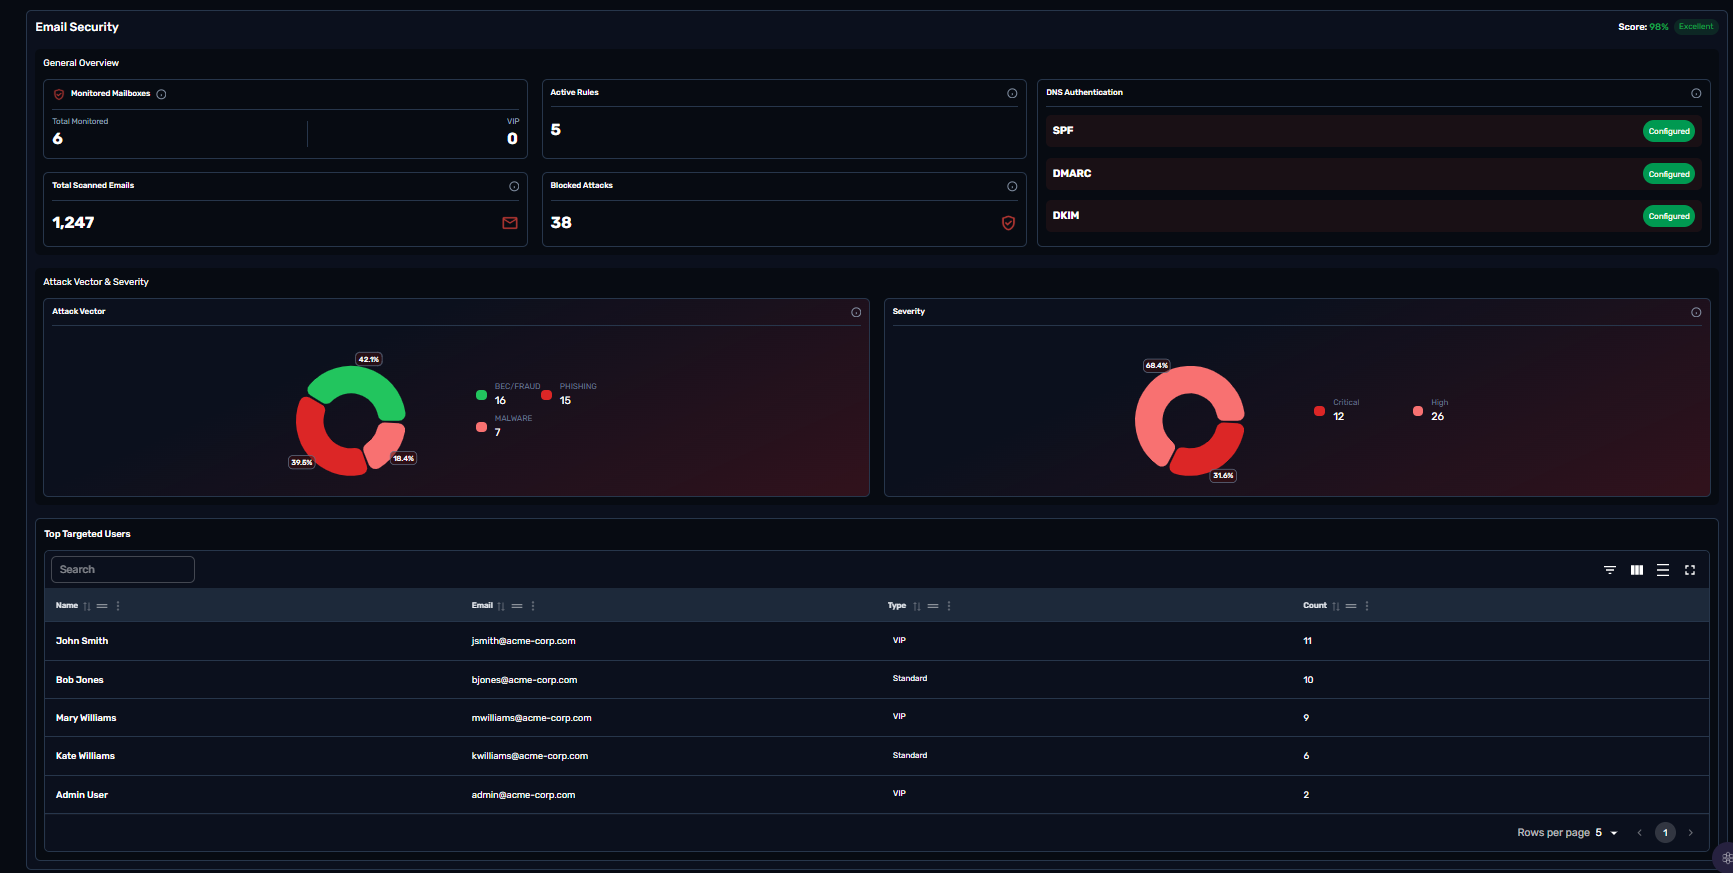
This module fetches data from the Email Security module in Hoplon, providing you with the main details of that module. General Overview shows monitored mailboxes, active detection rules, and the status of your DNS authentication records (SPF, DMARC, DKIM). The Attack Vector & Severity charts break down blocked threats by type — phishing, BEC/fraud, and malware — and by how severe each was rated. The Top Targeted Users table identifies which mailboxes (VIP or standard) are receiving the most attack attempts, helping you focus awareness training and extra scrutiny where it's needed most.
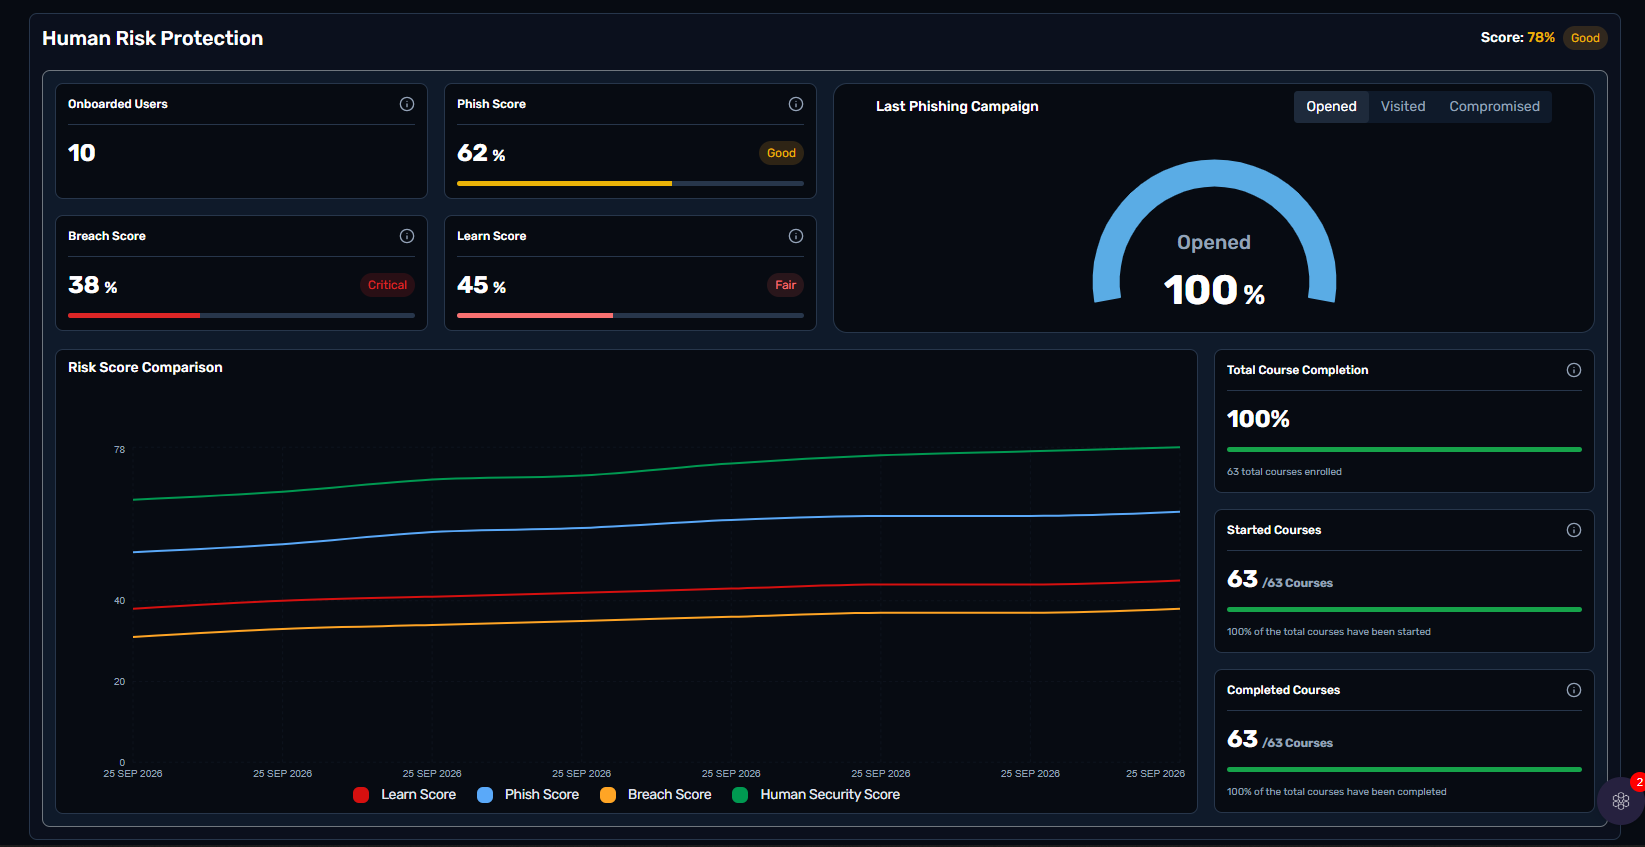
This module fetches data from the Human Risk module in Hoplon, providing you with the main details of that module. It tracks onboarded users, a Phish Score (resilience to phishing simulations), a Breach Score (exposure from known data breaches), and a Learn Score (security awareness training progress). The Last Phishing Campaign gauge shows engagement with the most recent simulated phishing test (opened, visited, or compromised), while the Risk Score Comparison chart shows how these scores are trending over time, and the course completion tiles show training enrollment and completion rates across the organization
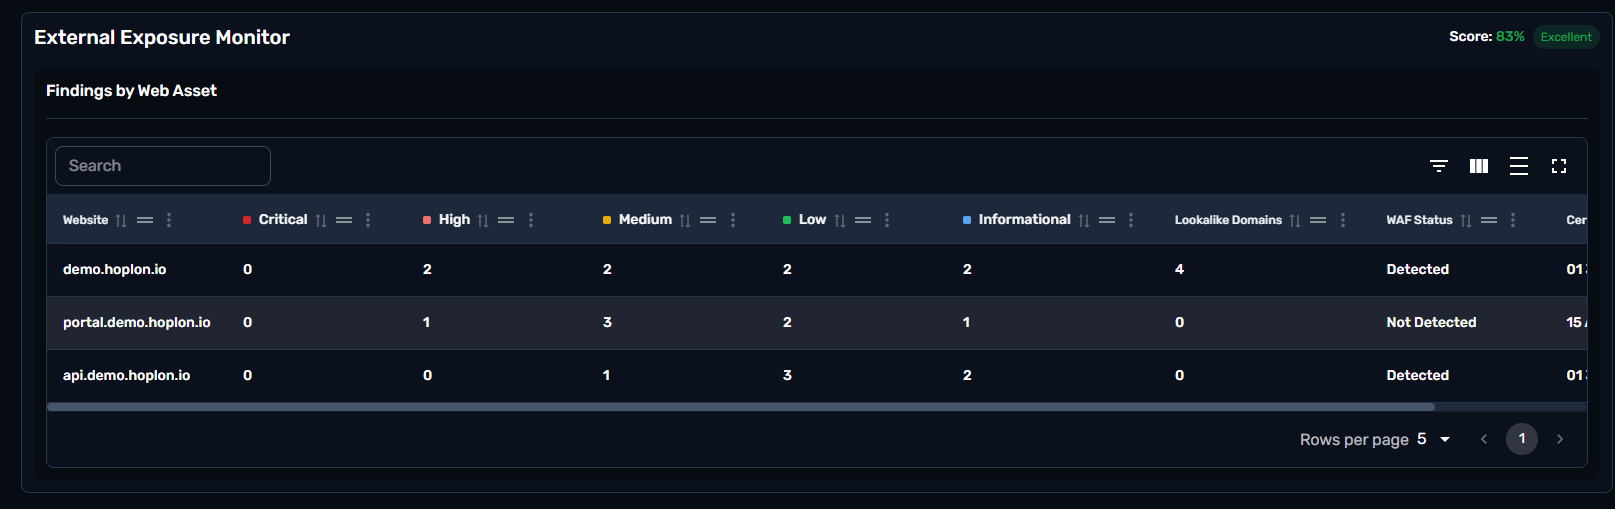
This module fetches data from the External Exposure Monitor module in Hoplon, providing you with the main details of that module. The Findings by Web Asset table lists each monitored domain or subdomain along with the number of critical, high, medium, low, and informational findings, whether lookalike/typosquatting domains have been detected, the status of your Web Application Firewall (WAF), and upcoming SSL certificate expiry dates — giving you an outside-in view of your attack surface.
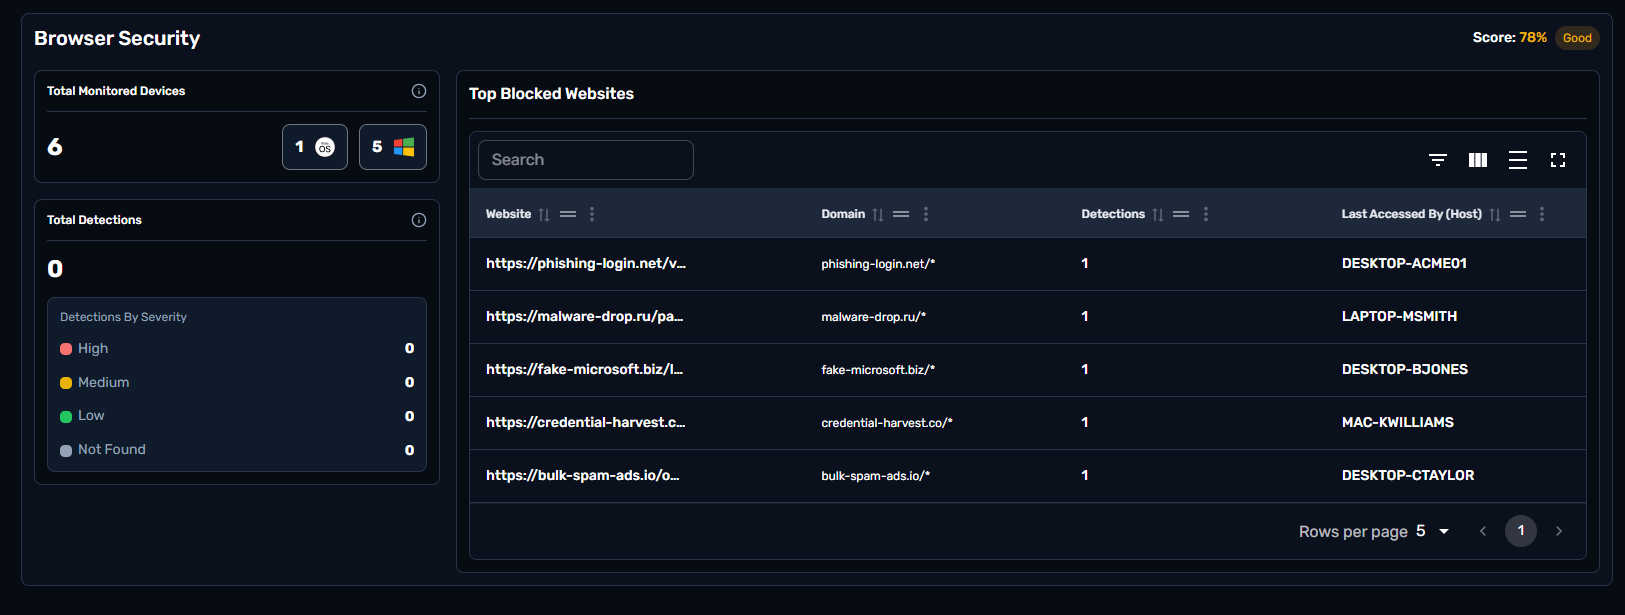
This module fetches data from the Browser Security module in Hoplon, providing you with the main details of that module. It tracks the total number of detections by severity across monitored devices, and the Top Blocked Websites table lists the specific malicious or suspicious sites (phishing pages, malware drops, credential harvesting sites, spam) that were blocked, along with which device attempted to access them — useful for spotting at-risk users or machines.
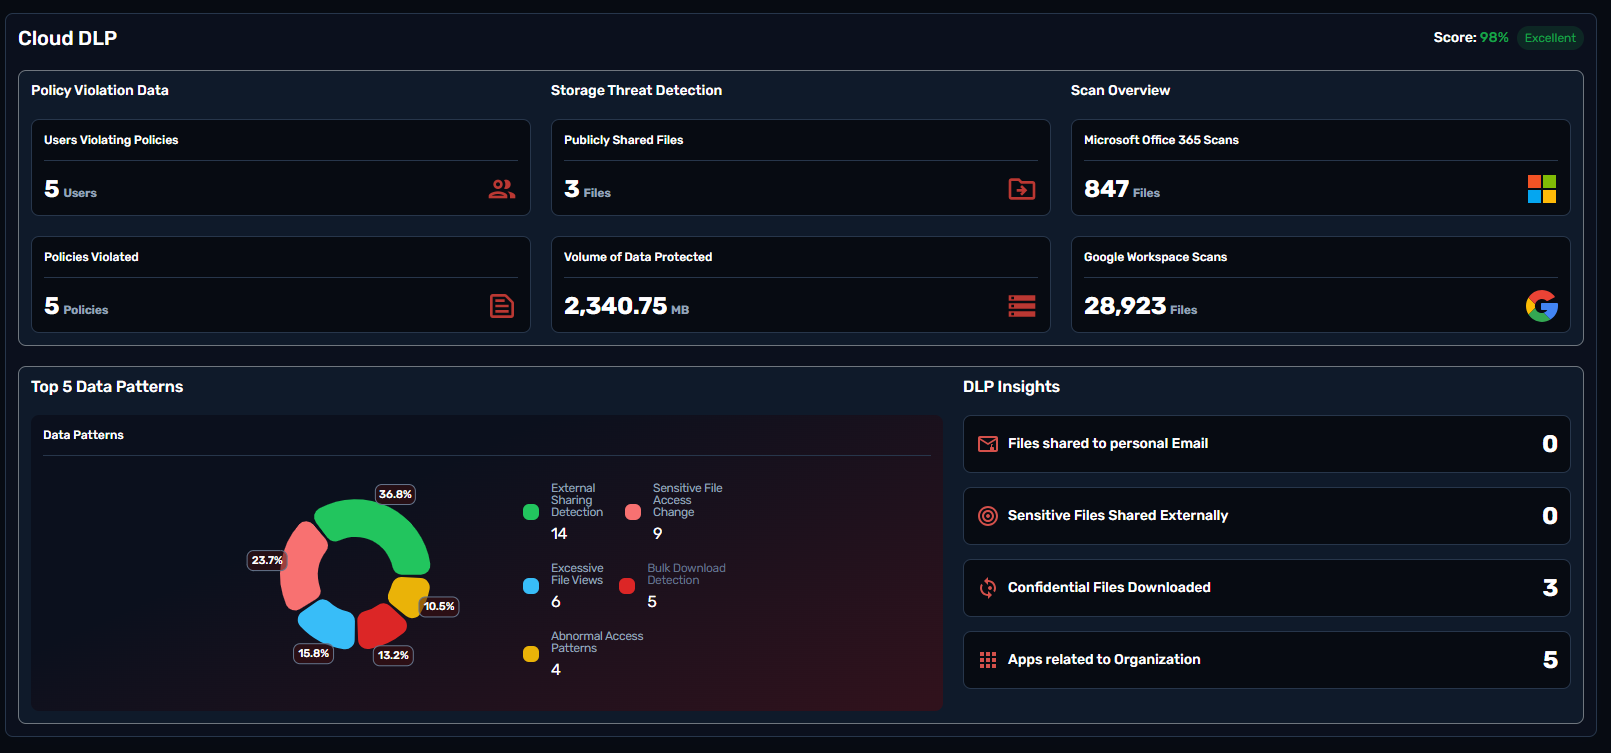
This module fetches data from the Cloud DLP module in Hoplon, providing you with the main details of that module. It shows how many users and policies are involved in violations, how many files are publicly shared, and the total volume of data scanned and protected across Microsoft 365 and Google Workspace. The Top 5 Data Patterns chart breaks down the type of policy violations detected (external sharing, sensitive file access changes, excessive file views, bulk downloads, abnormal access patterns), and the DLP Insights panel highlights specific risk indicators such as files shared to personal email or confidential files downloaded.
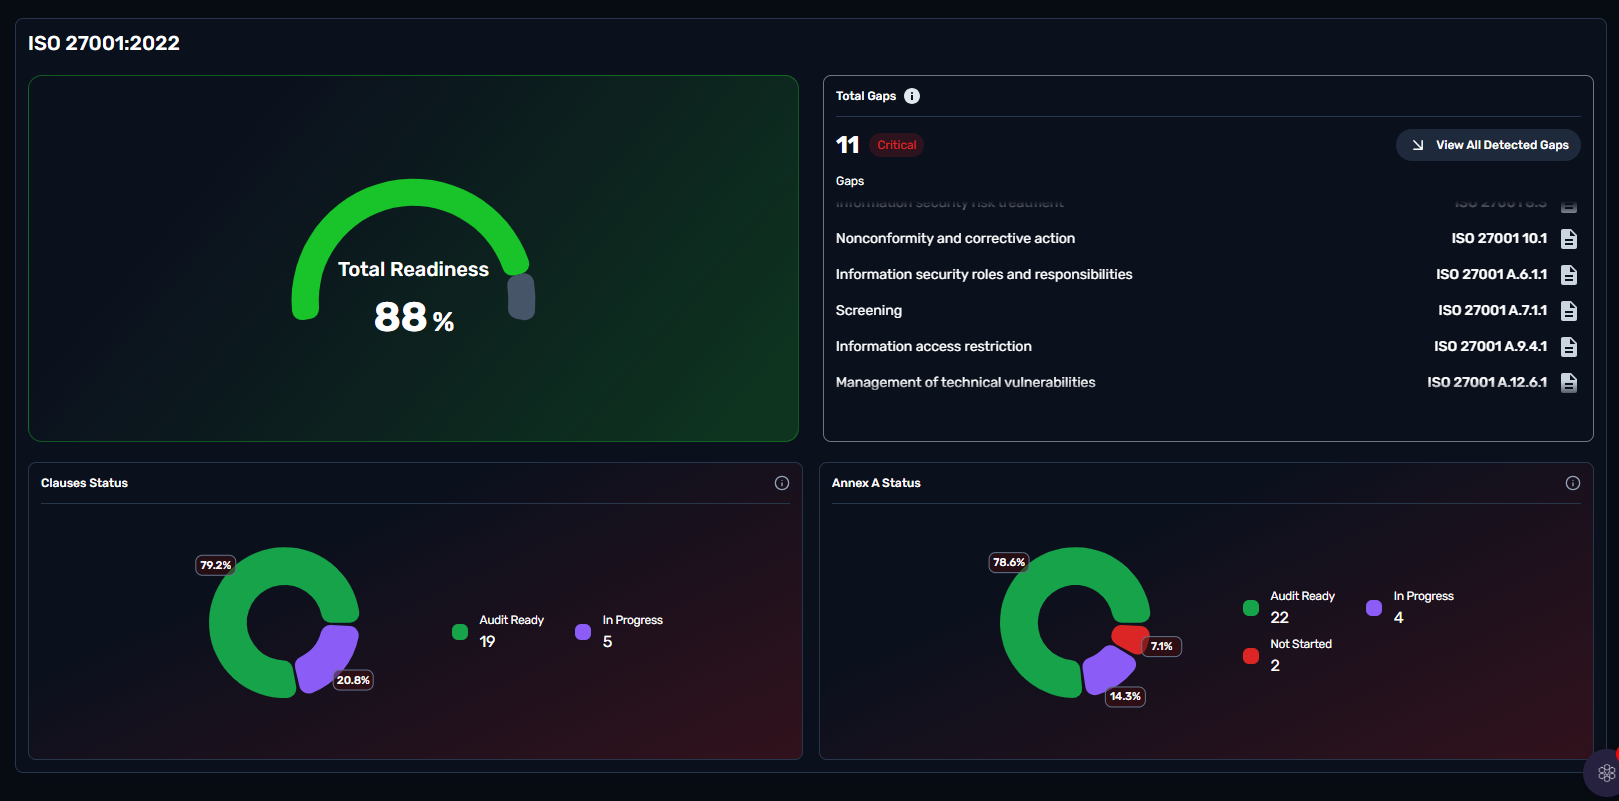
This module fetches data from the Security Policies / Compliance module in Hoplon, providing you with the main details of that module. The Total Readiness gauge gives an overall completion percentage, while Total Gaps lists the outstanding items — flagging critical ones — mapped to their specific ISO clause or Annex A control. The Clauses Status and Annex A Status charts break down how many requirements are audit-ready, in progress, or not yet started, giving a clear picture of what's left before an audit.