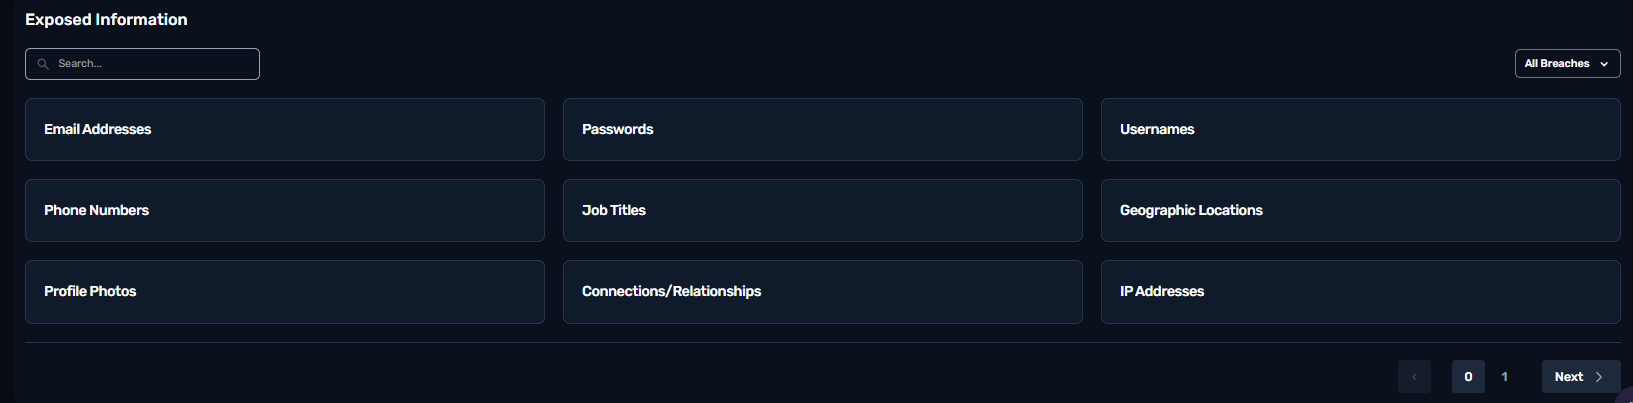
The Human Risk section assesses and highlights the security risks posed by human factors within an organization. This section provides insights into user behavior, security awareness levels, phishing simulations and past user breaches, helping administrators identify areas for improvement in user training and awareness.

What is Risk Score?
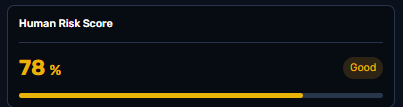
Risk Score is a metric used to assess the overall human threat to your organization. It provides a comprehensive evaluation of security risks at the organizational level.
Risk score allows you to assess the level of human error that your end-users are likely to commit. It allows you to gain an understanding of the general level of security awareness present in the organisation, as well as providing you with a breakdown by group or department. This helps you assess whether training has been effective, and prioritise the most imminent gaps in awareness.
How is Risk Score calculated?
Risk Score brings together all risk factors that are evaluated and mitigated on our platform.
The Risk Score calculation takes into account:
Volume of exposed data and personal information found on the dark web
Whether the user has opened, clicked or compromised their credentials in phishing simulations
Whether the user has completed their training courses and what grade they have achieved in them.
The Risk Score algorithm assigns the organization a score out of 0 to 100%, the scores are divided into the below tiers:
Above 80%(Green): Low risk, indicating strong security measures and minimal vulnerabilities.
79 - 60% (Yellow): Moderate risk, suggesting some weaknesses that require attention.
59 - 40% (Orange): High risk, highlighting significant security concerns that need immediate action.
39 - 0%(Red): Critical risk, signaling major security issues that require urgent intervention.
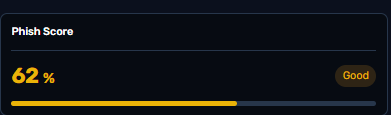
A metric that evaluates the likelihood of individuals within an organization falling victim to phishing attacks, the scores are divided into the below tiers:
Above 80%(Green): Low risk, indicating strong security measures and minimal vulnerabilities.
79 - 60% (Yellow): Moderate risk, suggesting some weaknesses that require attention.
59 - 40% (Orange): High risk, highlighting significant security concerns that need immediate action.
39 - 0%(Red): Critical risk, signaling major security issues that require urgent intervention.
What is learn Score?
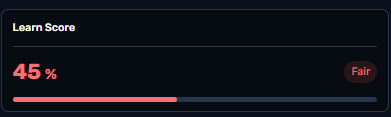
This score measures user participation and performance in security training programs. A higher score indicates greater engagement and understanding of security practices, which helps reduce overall risk. the scores are divided into the below tiers:
Above 80%(Green): Low risk, indicating strong security measures and minimal vulnerabilities.
79 - 60% (Yellow): Moderate risk, suggesting some weaknesses that require attention.
59 - 40% (Orange): High risk, highlighting significant security concerns that need immediate action.
39 - 0%(Red): Critical risk, signaling major security issues that require urgent intervention.
What is Breach Score?
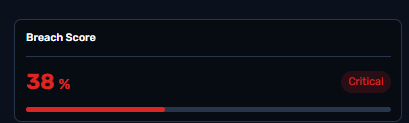
The Breach Score is a metric that tracks and notifies existing breaches that have occurred within an organization.
Above 80%(Green): Low risk, indicating strong security measures and minimal vulnerabilities.
79 - 60% (Yellow): Moderate risk, suggesting some weaknesses that require attention.
59 - 40% (Orange): High risk, highlighting significant security concerns that need immediate action.
39 - 0%(Red): Critical risk, signaling major security issues that require urgent intervention.
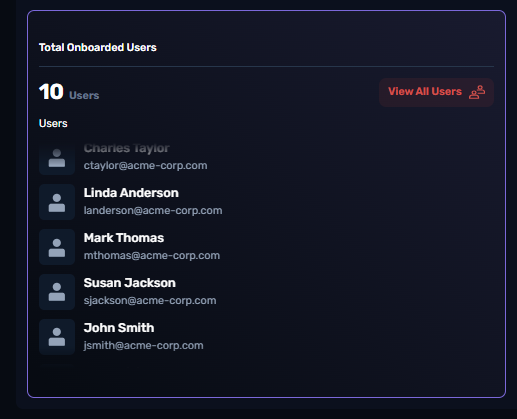
An interactive chart displays the number of users onboarded onto the HOPLONai Human Risk platform. Clicking on the chart reveals detailed user names, providing better visibility and tracking for seamless monitoring
What is Risk Score History?
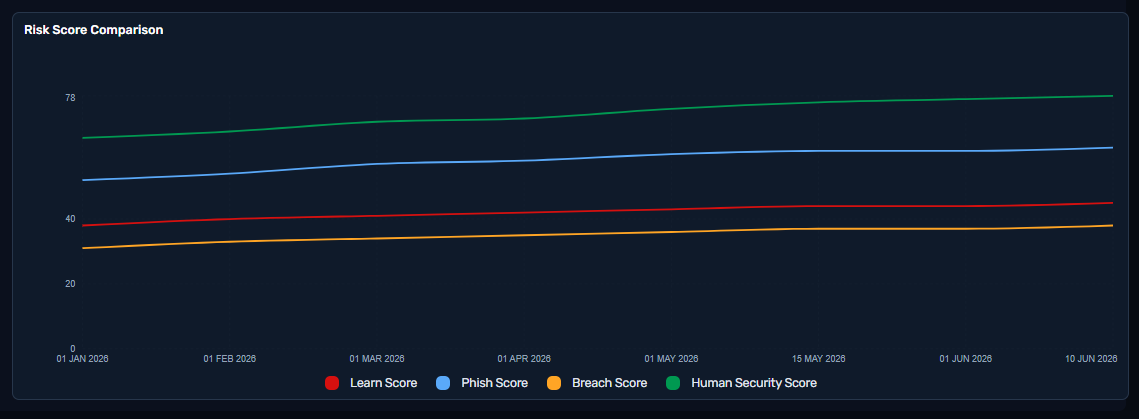
The Risk Score History chart aims to illustrate a clear view of how each risk factor evolves, identifying any significant changes that may indicate potential issues or improvements in security measures. It tracks four specific scores:
Learn Score,
Phishing Score,
Breach Score, and
Overall Risk Score
This section provides a quick overview of the progress and effectiveness of the Security Awareness Training program within the specified timeframe.

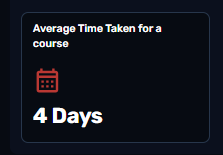
This metrics provides a quick reference to how long it typically takes participants to finish the training program.
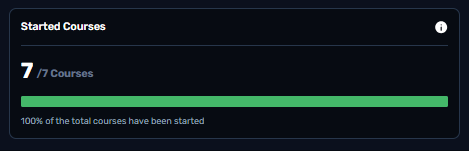
This metric highlights the percentage of courses that have been started but not completed, out of total.
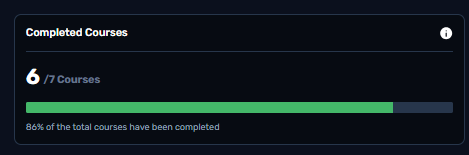
This metric highlights the percentage of courses that have been completed, out of total.
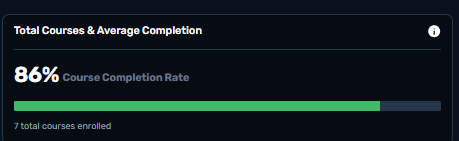
This metric highlights the average completion score that is achieved by participants.
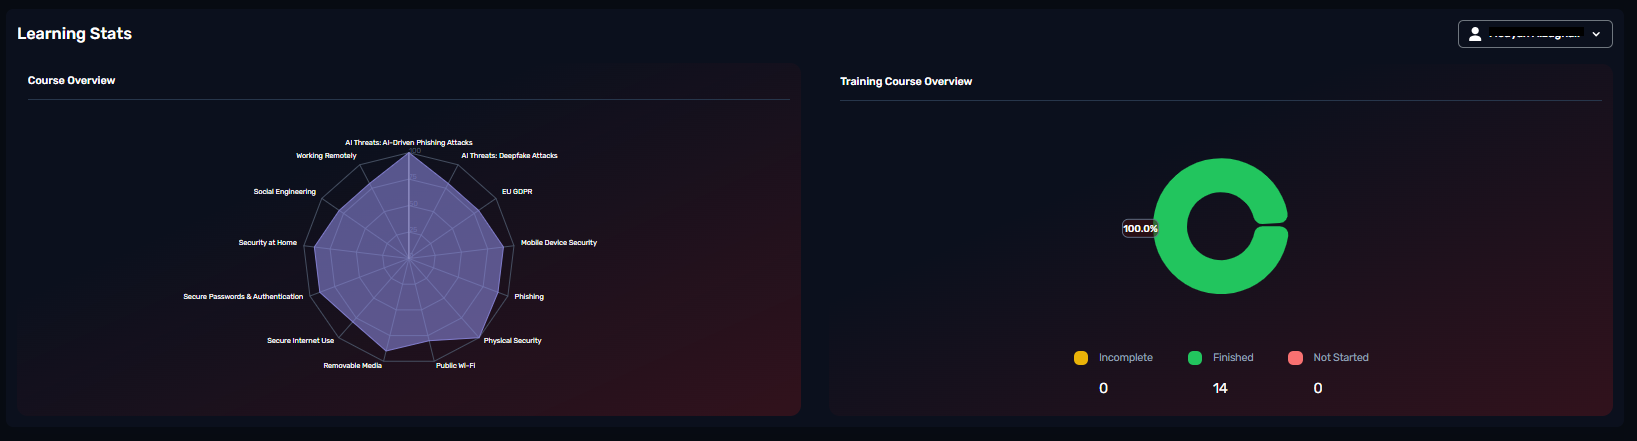
It provides insight into the engagement level of a particular participant with the training program. The graph's left side shows every course that a certain user needs to take along with the percentage of progress made in each module. On the right-side chart, the breakdown illustrates the percentage of courses completed, partially completed, or not yet started.
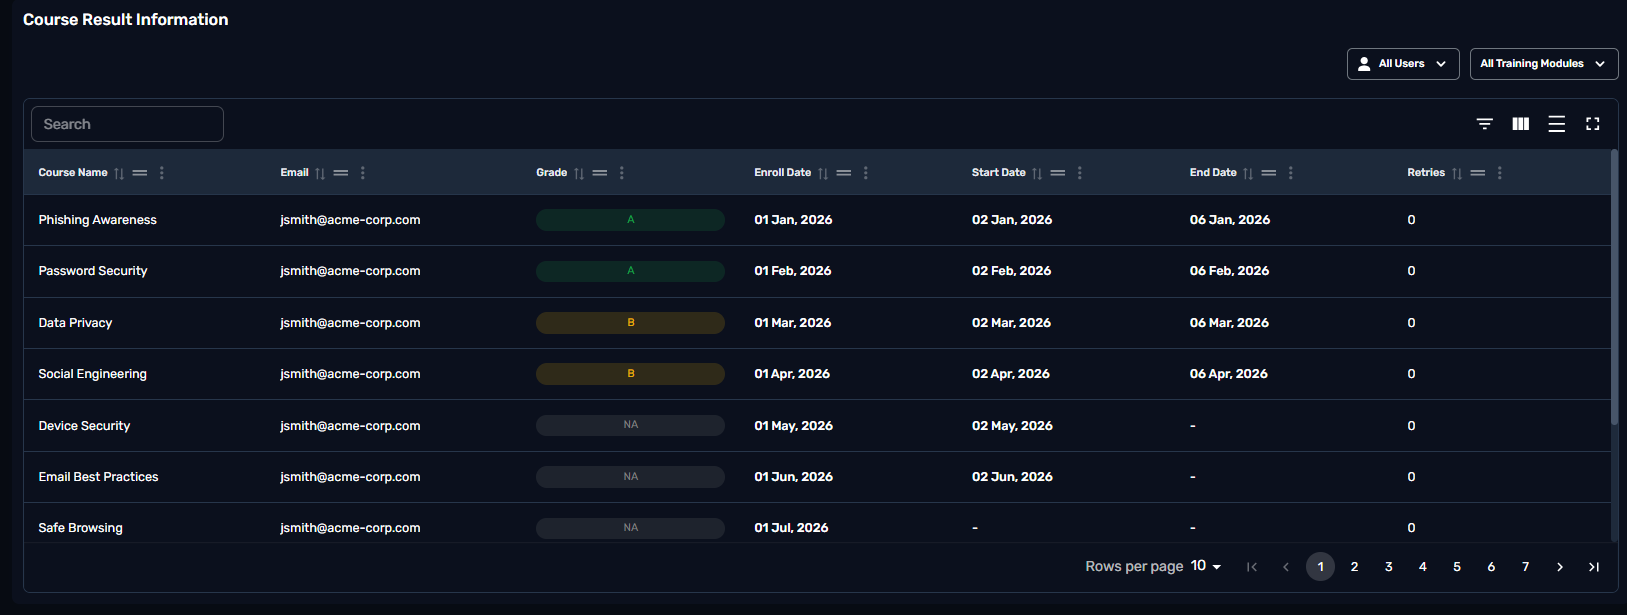
This table provides detailed course information for the users filtered in the Learning Stats chart. It includes each user's course grade, enrollment date, start date, and completion date
What is a phishing campaign?
A phishing campaign is a simulated attack designed to test and improve employee awareness of phishing threats. It provides automated phishing simulations that help organizations identify vulnerabilities and train employees to recognize and respond to phishing attempts.
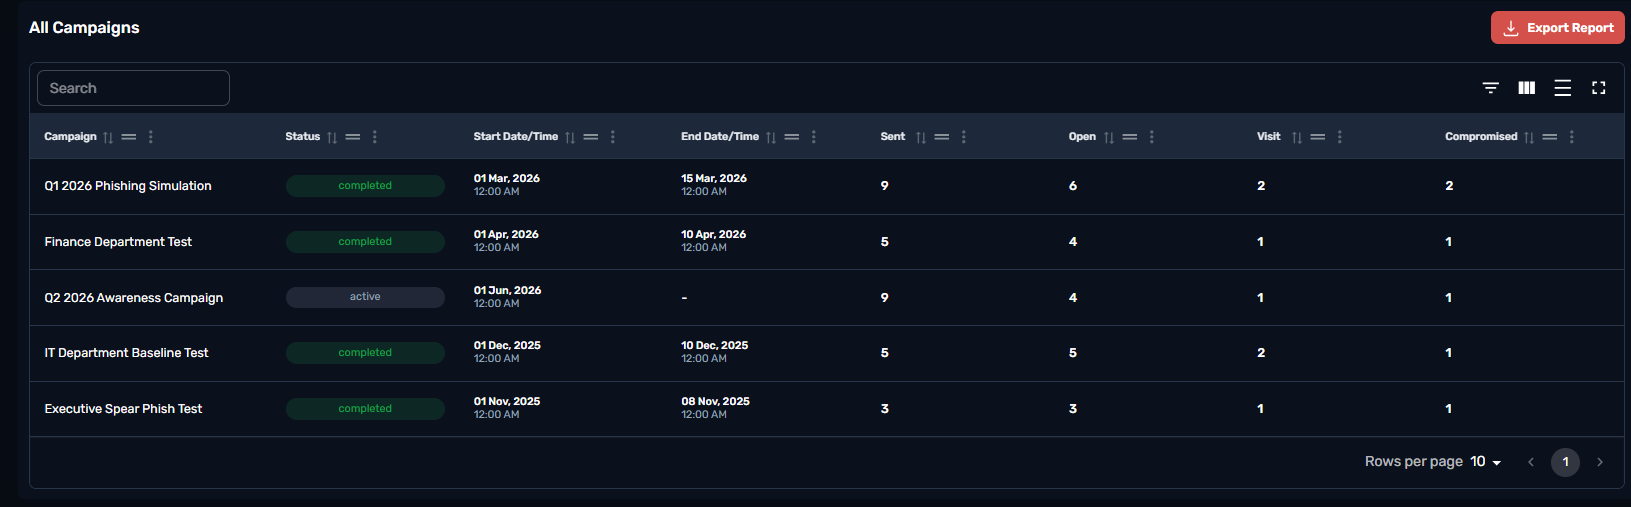
This table provides comprehensive details on the phishing simulation exercises conducted within the organization. Each entry includes the name of the phishing simulation, the type of attack (e.g., email, link, attachment), the list of recipients, and the current status of the simulation (finished, started, or pending). Additionally, it records the start and end times of each simulation, offering a detailed timeline of the exercise.
In order to be effective, training and testing should continue throughout the year. With regular phishing simulations, your users will be primed to always stay on the lookout for suspicious emails in their inboxes.

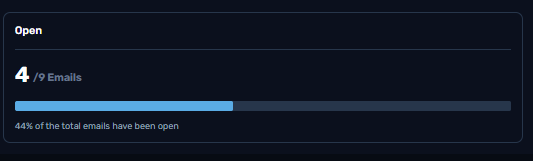
This metric displays the percentage and total number of users who opened a phishing simulation email
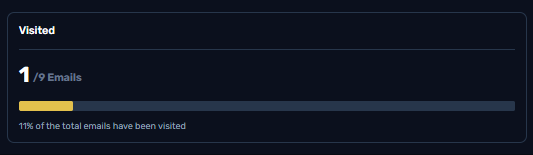
This metric displays the percentage and total number of users who visited a phishing simulation page or link.
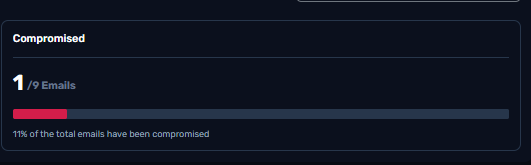
Compromised
This metric displays the number and percentage of user accounts that were successfully breached or compromised as a result of the phishing campaign. Such as entering credentials on a phishing site during the campaign.
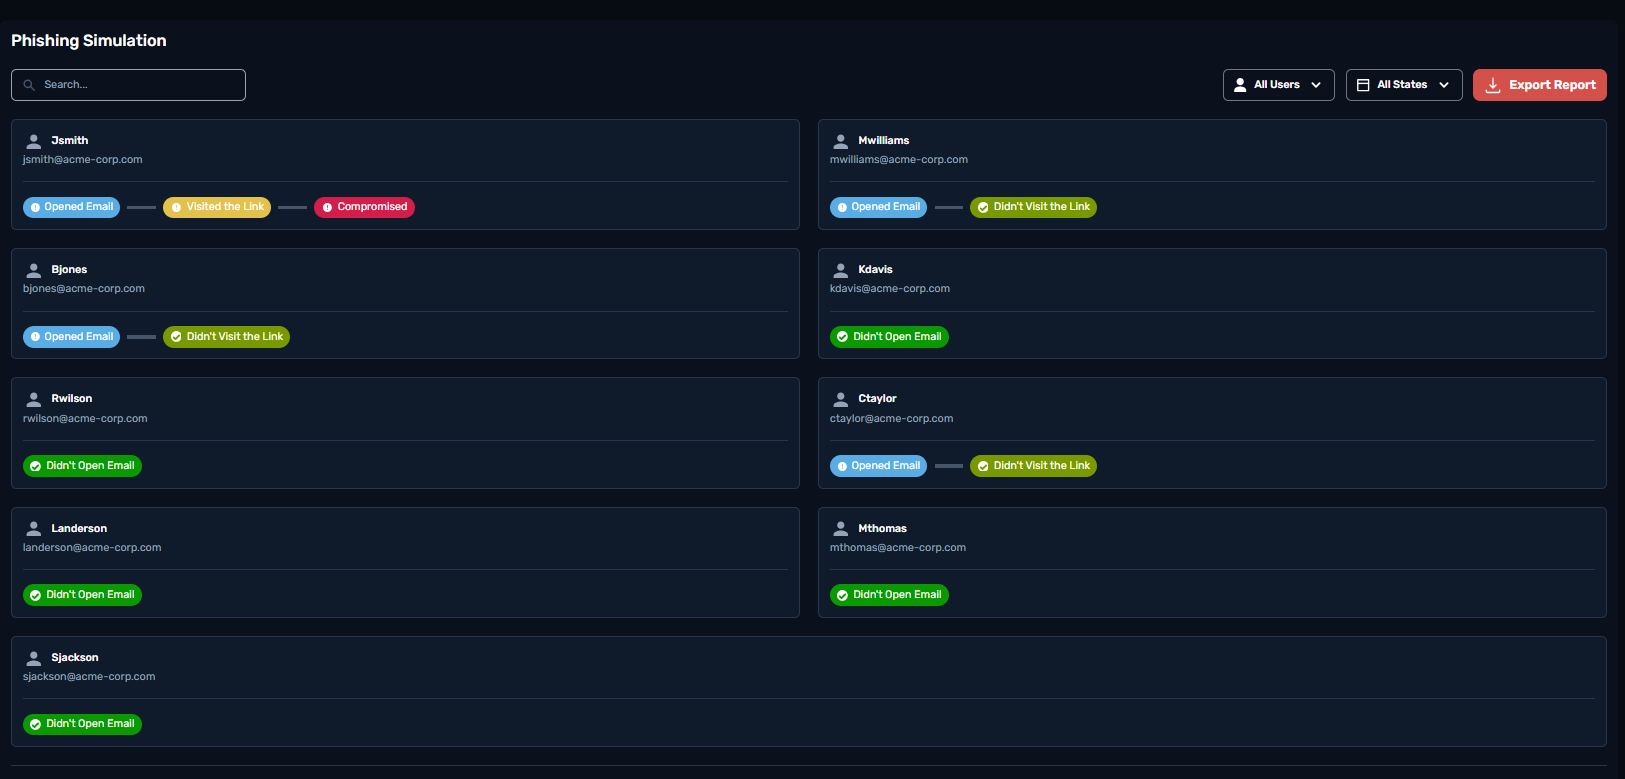
This table provides comprehensive details from phishing simulation exercises conducted within the organization. Each entry includes the email address of the targeted user, indicating whether they opened the phishing email, visited the malicious link, and if their credentials were compromised.
What is Dark Web Monitoring?
Dark web monitoring is a cybersecurity practice that involves scanning and tracking hidden online sources for compromised credentials, leaked data, or malicious activity related to an organization or individuals. It helps detect security breaches early and mitigate potential risks.

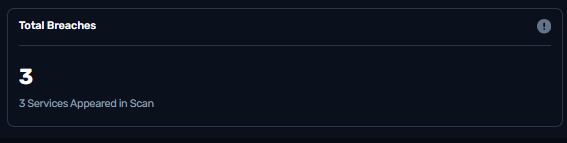
This metric displays the total number of breaches detected by the monitoring system, indicating instances where personal information, login credentials, or financial details have been compromised and potentially made available on the dark web.
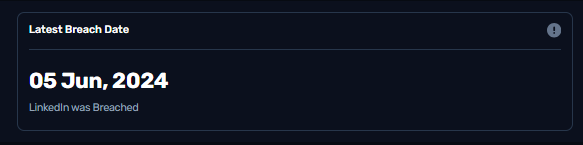
This metric displays the most recent data breaches detected by the monitoring system, indicating instances where personal information, login credentials, or financial details have been compromised and potentially made available on the dark web.
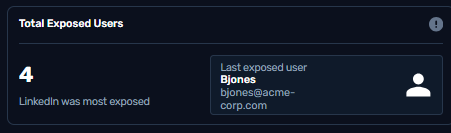
This metric indicates the total count of users whose sensitive information has been compromised and potentially made available on the dark web.
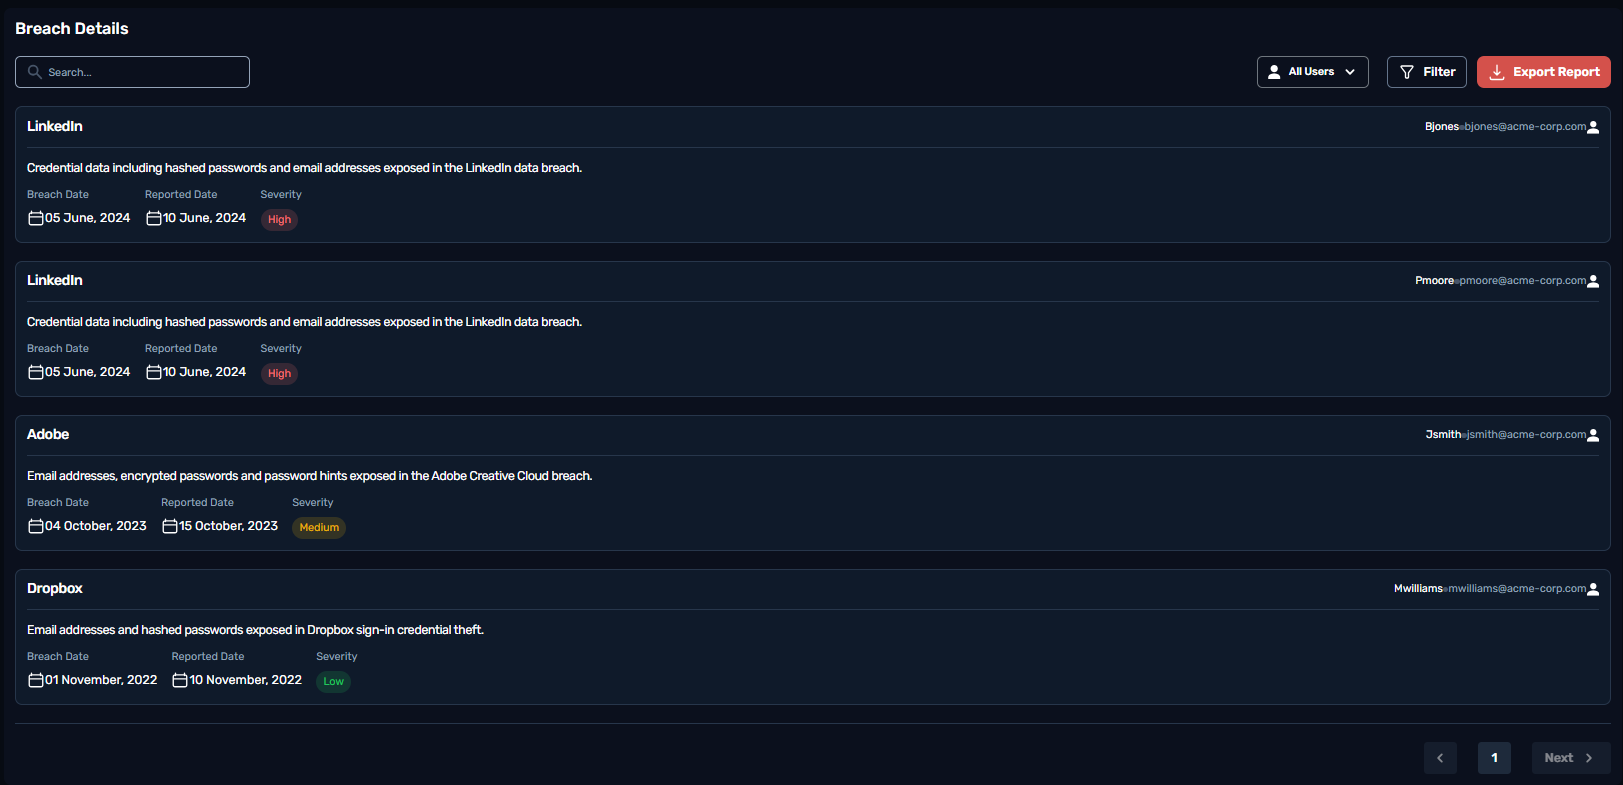
This table provides comprehensive details of specific data breaches detected by the dark web monitoring system. It includes crucial information such as the breach name, severity level, associated email address, breach date, reported date, and a summary of breach details.
This table provides detailed insights into the types of sensitive data compromised and potentially available on the dark web.